Tuesday night saw the team from Microanalysis swap our lab coats for tuxedos and gowns as we attended the 2015 Telstra Business Awards at the Crown Grand Ballroom. It was a fabulous evening celebrating the achievements and innovation of small businesses in WA.
After an extensive application process that analysed all aspects of business processes from customer satisfaction to financial management and a thorough judging by industry leaders, 23 finalists were invited to attend this prestigious evening. Microanalysis was honoured to be among them as a finalist in the small business category.
The evening treated us to some inspirational speeches by past winners and in particular keynote speaker Carolyn Creswell, founder of Carman’s. Carolyn is a true inspiration and an example of what hard work and determination can achieve. She took a small backyard muesli making operation and built a strong, successful business retailing in multiple countries around the world, all whilst raising 4 children. This down to earth incredible woman was a delight to meet. The parallels of Microanalysis starting in our backyard shed with two toddlers were not lost on us! Perhaps perseverance will see us there again next year, as we take a leaf out of Carolyn’s book, having entered the awards 16 times herself
prior to winning.
The Small Business category award went to injuryConnect. Congratulations to them on this fabulous achievement.
Executive Risk Solutions were the overall winners on the night taking out both the medium Small business award and the WA Small Business award. Well done guys!
We would like to thank our incredibly talented and dedicated staff for making Microanalysis the amazing business we are exceptionally proud to be a part of.
We would also like to thank you, our clients who appreciate accurate, innovative analytical problem solving. Clients who expect the best and enable us to deliver.
Telstra WA Business Awards Finalist 2015
Microanalysis Australia has been named as a finalist in the Telstra WA Business Awards 2015. The team wishes to thank all our clients for their continued support. We love what we do for you.
You may have heard reference to ‘particulates analysis’ on TV series such as CSI or Bones, where the investigators send off all kinds of things to ‘The Lab’ for Particulates. From shoes to car bumpers, and skin swabs to plants, this can help these fictional investigators solve a wide variety of mysteries.
This isn’t just fiction! Particulates analysis is used in real life to solve all kinds of puzzles – to determine where an object has been, how a motor is failing, where that piece of glass was manufactured or whether it’s your neighbour’s fault that your car is covered in dust. Particulates analysis involves identifying particulate material and separating the expected particulates (natural dust, dust from your own industrial processes or projects, etc) from contaminant or suspect particulates (dust from nearby factories, metal shavings, sawdust, etc). By examining the morphology (shape) and elemental composition of particles, we can match them to known sources of dust or compare them to samples from the suspected source. In the past, Microanalysis Australia has helped to prove:
Dust found on cars was from the spray painting and grinding conducted at a nearby panel beaters;
The identity and potential hazards of foreign objects in packaged food;
The source of localised discolouration on cooked chicken;
The identity of contaminants in food products;
A lung biopsy sample was alpha-quartz;
A blocked filter was from the epoxy pipe lining failure;
Which nearby factory was causing dust problems in neighbouring residential areas; and
Whether paint was over thinned/filled or diluted with the wrong thinners.
We use a variety of techniques to identify particulates, including SEM, XRD and FTIR, depending on the type of material. Ask us about the best way to solve your own mysteries!
Concrete Analysis by Electron Microscopy
From holding up the roof above your head, to getting you between A and B, concrete is used in a myriad of ways that make our lives what they are.
Concrete, a mix of tri-calcium silicates (otherwise known as cement), sand, aggregates (as well as few other plasticity modifiers, setting retardants, etc.) and most importantly, water, is a compound that has been studied by people (not unlike us at Microanalysis) since before the Romans learned how to take a bath.
Once wetted, the hydration products start to form and concrete begins to set – hey-presto, your ornate mosaic tiles are hopefully forever fixed to your steam room floor! What you actually end up with is hopefully a solid mixture of fine air voids, capillary pores, hydration products, unreacted cement and sand/aggregates. But, get the mix wrong and you’ll have more than Caesar’s face sticking to your feet.
Non-compliance these days can see investigations into water:cement and sand:cement ratios as well as aggregate types (alkali-silicate reaction) and non-heterogeneity of mix. Traditional methods employ lengthy physio-chemical techniques such as BS1881:124:1998 but have been suspected of large inaccuracies for many years (A.M.Neville (2003), “How closely can we determine the water-cement ration of hardened concrete”, Mat. Struct. 36, 311-318.).
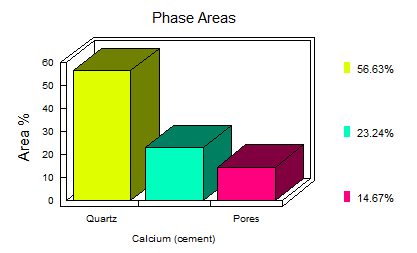
Apart from obtaining colourful images, the method allows you to determine the volume fraction of reacted /unreacted cement, capillary pores and hydration products. So, a quick thin-section, carbon coat and 15 minutes worth of x-ray mapping and the images below can be interpreted to report both the
water:cement and sand:cement ratios as well as an in-depth interpretation of swelling aggregates (ASR), ettringite formation (sulphate presence), carbonation, chloride penetration and calcium dissolution/leaching.
Laser Interferometry (LI) versus Scanning Electron Microscopy (SEM)
The power of the Scanning Electron Microscope (SEM) as an imaging tool is well known. Exceptional resolution, incredible depth of field and high magnifications allow an SEM equipped with a secondary electron detector to produce images detailing surface topography with a wide depth of focus. In addition, the use of a backscatter electron detector and an energy-dispersive x-ray spectroscope (EDS) permits the collection of elemental information from the sample, allowing you to literally look beneath the surface and see the elemental composition. There are, however, some limitations on the sample itself to be imaged with an SEM.
In order to image with an SEM, the sample must be conductive to allow the electrons that bombard the sample to dissipate to ground and not be repelled by a charging sample. If the sample is electrically insulating, the surface of the sample retains the electrons, gaining an overall negative charge that then deflects away subsequent electrons which in turn prevents imaging. For samples that are not naturally conductive, a conductive layer (carbon or metal) is applied to prevent this charging effect, thus modifying the sample. A second limitation is that the sample must be small – small enough to fit into the SEM. This, of course, is not an issue for some samples, but for others it can mean breaking, cutting or scraping the sample to create a suitable sub-sample. Lastly, in order to clear a path for the electron beam used for imaging, the sample chamber is evacuated to achieve a high vacuum and eliminate the interference caused by molecules in the air. Therefore samples that are sensitive to vacuums or that may emit gases or vapours under vacuum may require lengthy preparations before imaging by SEM.
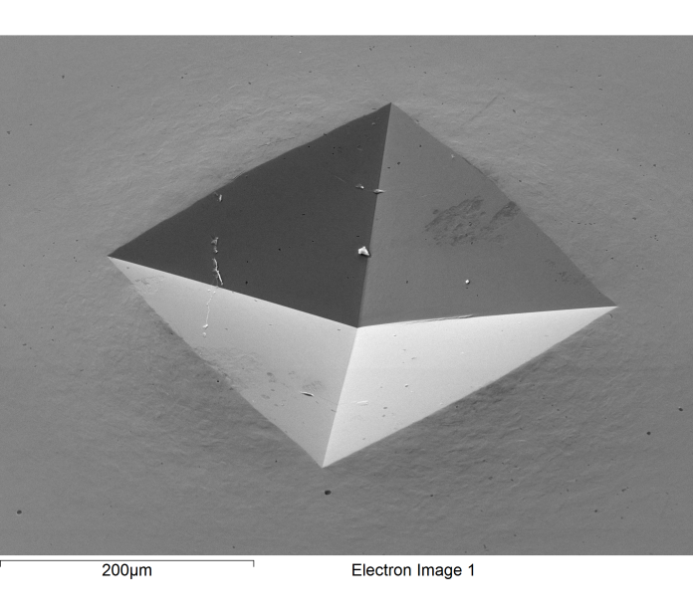
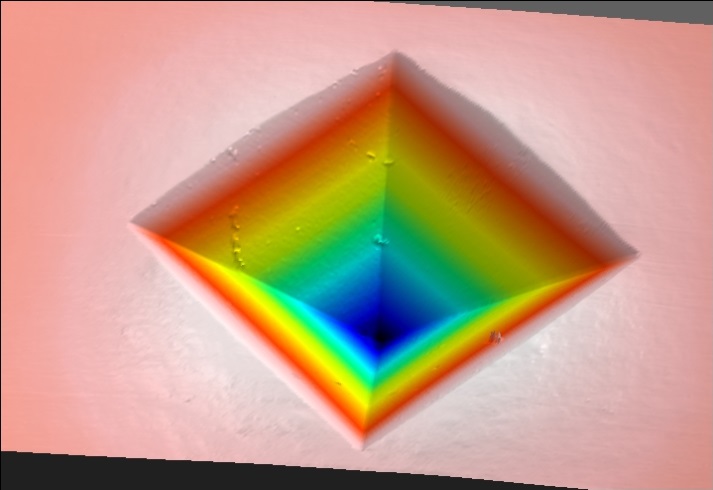
Laser interferometry (LI) offers an alternative imaging tool that is comparable to SEM imaging with a much shorter list of sample limitations. LI does not require a conductive sample as the imaging beam is a low-power laser rather than an electron beam. The sample size can be much larger – up to 10cm by 10cm by 5cm – and the sample can weigh as much as 12kg and still be analysed. Lastly, the scans occur in the open air ensuring that there is no issue with scanning samples that may emit gas or vapour products under vacuum. Of course, LI is by no means the equal of SEM when it comes to very high magnification work but Figures 1 and 2 below show that it is possible to consider the two as comparable for lower magnifications (each edge of the pit is 14.2µm in length). In fact, when a study is made of the imperfections on the back-left plane and the surface ‘rippling’ on the four edges of the pit, the comparison becomes more obvious. In addition to imaging, LI can be used to make a wide range of measurements ranging from simple pit depths to waviness/roughness profiling and direct surface comparison. All this gives LI a unique skill set ensuring its usefulness as an imaging and measurement instrument for a wide range of samples.
 all backyard muesli making operation and built a strong, successful business retailing in multiple countries around the world, all whilst raising 4 children. This down to earth incredible woman was a delight to meet. The parallels of Microanalysis starting in our backyard shed with two toddlers were not lost on us! Perhaps perseverance will see us there again next year, as we take a leaf out of Carolyn’s book, having entered the awards 16 times herself