Speciating contaminants in everyday products, from food and beverages to crime scenes, from building materials to aviation fuel, understanding the composition of errant particles is key to determining the source and solving the reason they ended up in places they weren’t meant to be! Microanalysis Australia is keen to announce the addition of an FTIR microscope to it’s line of investigative equipment.
Our PerkinElmer Spectrum2 now has an accessory which allows enhanced spatial resolution to discriminate particles down to 20 µm in size against backgrounds which would otherwise swamp a typical ATR measurement. Multi-layer specimens such as paint films can now be analysed to determine polymer composition differences between coatings – matching paint flecks to potential sources and confirming proper application etc, to name a few. Microanalysis is routinely requested to filter solutions, from potable waters, to agrochemicals to look at known contaminants and determine possible sources. Whilst SEM/EDS has been an enormous help with these unknowns in the past, FTIR microscopy adds another string to the bow of being more absolute in pin-pointing the ultimate source of the tinniest of particles.
ACA and SCAA Laboratory Tour
On Wednesday 1st November, Microanalysis held a special information evening for the Australasian Corrosion Association (ACA) and Surface Coating Association Australia (SCAA) professional associations.
Pulling everyone away from the tasty nibbles and drinks, the 12 members had a guided tour of the Laboratory to learn a little of what Microanalysis Australia is up to in the corrosion field as well as in a diverse range of other industry sectors.
Exploring the lab, the delegates learned about spatial elemental analysis in the two Zeiss SEM/EDS systems, identifying corrosion products versus naturally occuring ferrous phases in the two Philips/PANAlytical XRDs, sizing microbes in the Malvern Mastersizer, understanding settling rates using a Sedigraph, Hiac Royco Particle Counters for contaminat concentration determination in liquids – particularly important for corrosion inhibitor cleanliness and surface corrosion and pitting analysis on the Solarius Laser Profilometer.
The group learned about the UNDG testing that Curtin University and Microanalysis have been involved in with regards the C1 ‘Localised Corrosion – Intrusion depth’ research. The Solarius Profilometer has been an invaluable tool in terms of scanning large corroded areas to obtain pit depth and profiles.
After the tour, the group returned to the drinks and food where Nimue Pendragon and Owen Carpenter presented some information about failure analysis using SEM EDS, bulk goods testing by ADG and IMDG, and UNDG C1 corrosion analysis by laser profilometer. Download a copy of the presentation below.
We hope an informative evening was had by all.
Energy Dispersive X-ray Spectrometry for Determining Chloride Concentration Profiles in Concrete
Liam Holloway1 and Nimue Pendragon2
1Principal Engineer, MEnD Consulting
2Lead Consulting Scientist, Microanalysis Australia
Abstract: Assessing the condition or durability performance of existing reinforced concrete infrastructure can involve a broad range of investigation techniques. Investigations during the life of the structure can be used to inform the asset management process. A typical test reg ime will involve visual inspection, cover meter surveys, electrochemical testing, strength assessments, and the collection of core samples for a range of analytical chemical testing. In cases where there is a perceived risk of Alkali ‐ Silica Reaction occurr ing, the testing regime may also include uranyl acetate fluorescence screening, or petrography. Petrography can be done using optical microscopy or Scanning Electron Microscopy (SEM). While petrography can be used to determine the likelihood of ASR, it is also able to give an indication of other concrete properties including, porosity, cement content, and strength. SEM petrography with the combination of Energy Dispersive X – Ray Spectroscopy (EDS) can also provide semi quantitative assessment of other proper ties including but not limited to; aggregate cement ratio, and chloride content. In this paper, we propose that the use of SEM petrography and EDS can provide a more efficient and cost effective way to gather most of the information required to perform dur ability assessments of existing structures. While the use of SEM petrography is not a new concept , using EDS to determine chloride concentration profiles is a novel approach. In this paper, we compare chloride profiles from SEM – EDS against those gained fr om conventional wet chemistry. The results from both assessment techniques were fit to estimate the apparent chloride diffusion coefficients .
For a full copy of the paper please use the following link:
Customisable Mineral Liberation
From lithium to heavy metals, Microanalysis offers customisable mineral liberation and association analysis for ores and concentrates of all kinds. Complementary to our petrographic capabilities, Microanalysis can analyse a range of particulate sizes up to 3 mm and provide additional manual analysis for particles >3 mm.
INCA Mineral by Oxford Instruments (product information available here) is a software package allowing for automated mineralogical analysis including mineral liberation, association data, size, morphology, deportment and more. INCA Mineral can emulate QEMScan data outputs, and be customised so you get only the information you need.
Usually QEMScan is recommended for particles up to to 500 µm – using a custom setup of INCA Mineral, our technique can analyse particles up to 3 mm. Still too small? Microanalysis has developed an equivalent, manual, technique for particles >3 mm using a combination of correlated optical and electron imaging, EDS and X-ray mapping.
Speaking of small – light elements (H, He, Li, Be) are always problematic from an analytical point of view. Too small for XRF and even EDS, indirect detection methods are required to ‘see’ lithium in mineral samples. Using image contrast and Si:Al ratio we differentiate spodumene and petalite from non-lithium aluminosilicate minerals, allowing us to determine the liberation and association of lithium bearing minerals. Lithium-bearing micas are even trickier, with a wide range of elemental compositions, so we combine our geological and petrographical expertise to characterise the lithium bearing micas and create a ‘fingerprint’ for the lithium bearing species, using the trace substitutions and specific elemental ratios to classify these minerals. We cross check our data with XRD results to give a comprehensive mineralogical assessment.
Whether it’s characterisation of light element minerals, characterising impurities in high purity sands, or simply gaining an idea of what your sample is, Microanalysis can help you get the most from your samples using our technology and expertise.
Petrographic Analysis & Thin Sectioning
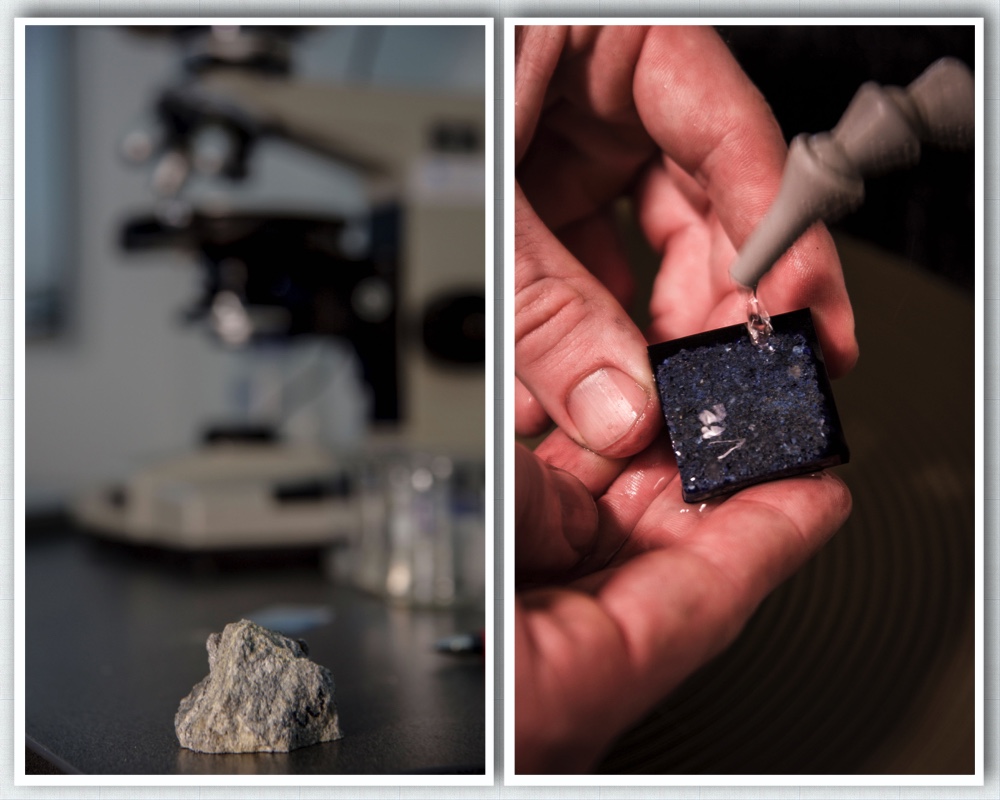
Thin sections are 30 µm (0.03 mm) thick slices of rock, minerals, concrete, mortar, or other materials that are mounted to a glass microscope slide with epoxy and topped with a glass coverslip. They are typically analysed by geologists and petrographers by using a petrographic microscope (sometimes referred to as a polarizing light microscope). Petrographic microscopes allow experienced analysts to investigate the sample in great detail to collect data regarding the sample mineralogy, overall texture, individual mineral texture, microstructures present, and much more. In the case of rocks and minerals, a geologic history can be interpreted by the data collected via petrographic examination. With regard to concrete, it allows for deformation mechanisms to be identified and for many other issues to be investigated.
How exactly are standard thin sections made? First, a sample is cut to fit on a standard petrographic microscope slide (typically 27 x 46 mm). Once cut, one side of sample is lapped (semi-polished) to create a flat, smooth surface. The flat smooth surface is then mounted to an etched microscope slide with epoxy. Once the epoxy has set, the sample is prepped with a thin sectioning system. These systems have two components: a saw blade and a grinding wheel. The glass slide with the mounted sample is held to a vacuum chuck by a vacuum pump. The chuck with the sample is safely guided into the saw blade, cutting it to a thickness of <1 mm. After cutting, the sample is moved to the grinding wheel side of the system. The sample is rocked back and forth along the grinding wheel, and a micrometre is used to measure how much of the sample has been ground away. When the thickness of the sample is near 30 µm, the sample is removed from the system and ground by hand to reach a final thickness of 30 µm (thinner than human hair). A coverslip is applied to the finished section with epoxy to fill in imperfections in the slide and to protect the sample from scratches and other damage.
With regard to a geologic investigation or a structural evaluation of concrete, the devil is in the details. Petrographic examination of thin sections pertaining to those investigations or evaluations allows for those details to be documented and evaluated in a way that no other technique can match.
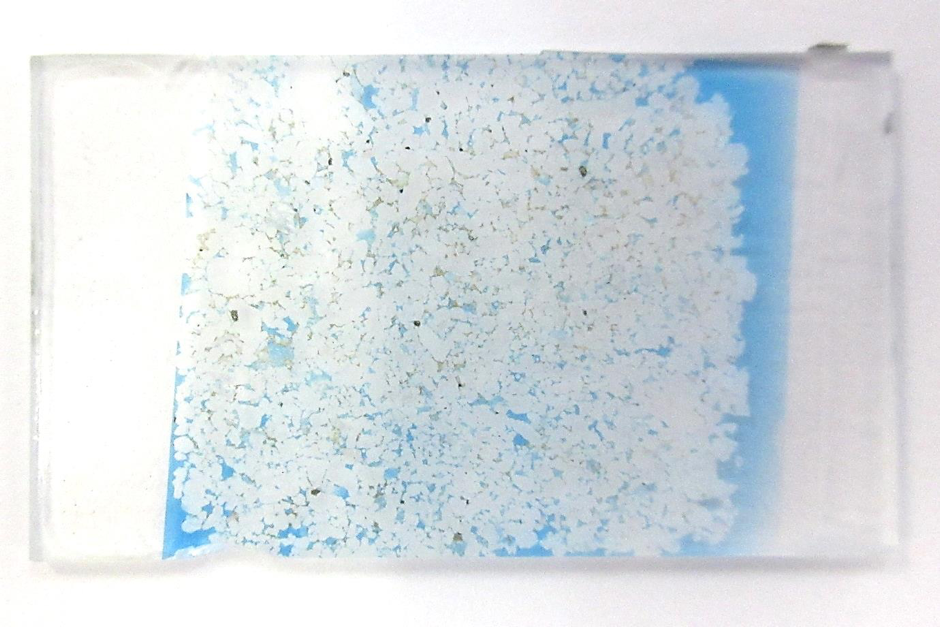
Finished Slide: 30 µm thickness
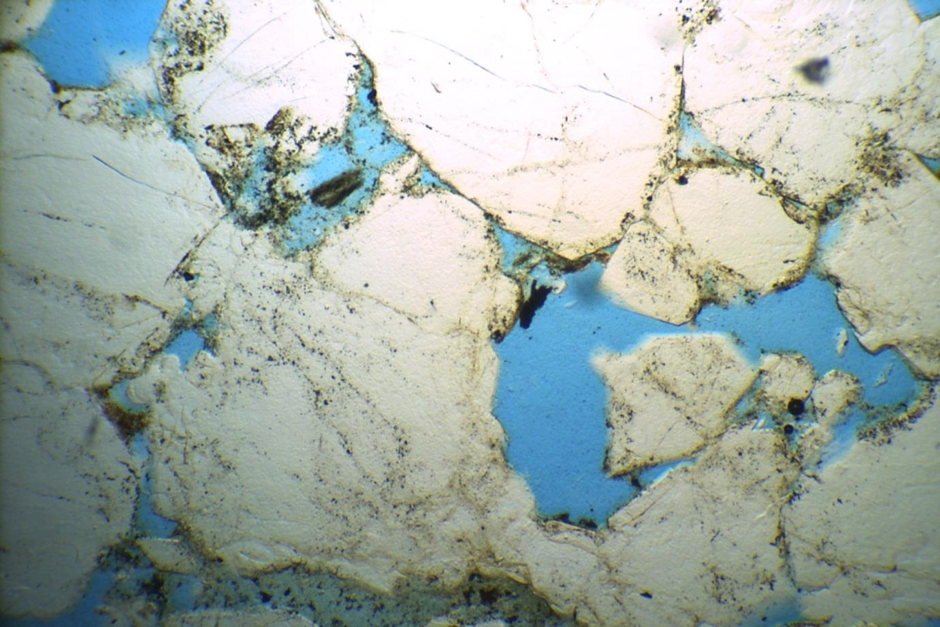
Plane-Polarized Light: Field of view from left to right is approximately 2mm
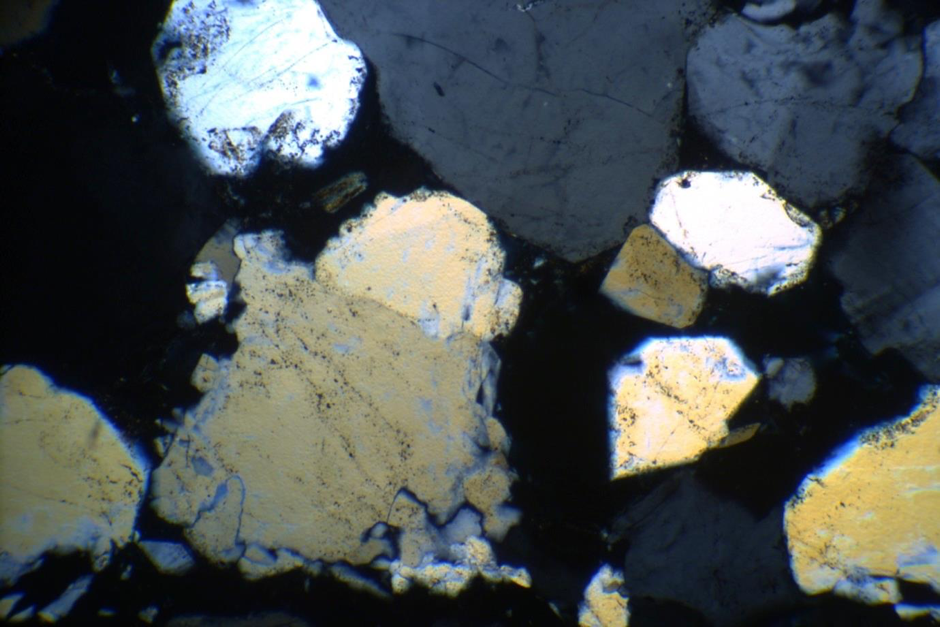
Crossed-Polarized Light: Field of view from left to right is approximately 2mm
For more information on how we can assist you with thin sectioning or petrographic examination, please contact our Specialist Geologist/Petrographer Dan Cukierski or Rick Hughes on +61 8 9225 5810.